WEBSITE: COVID-19 Impact on Life
︎︎︎What I learned: Hand Coding | Data Visualization | Information Organization
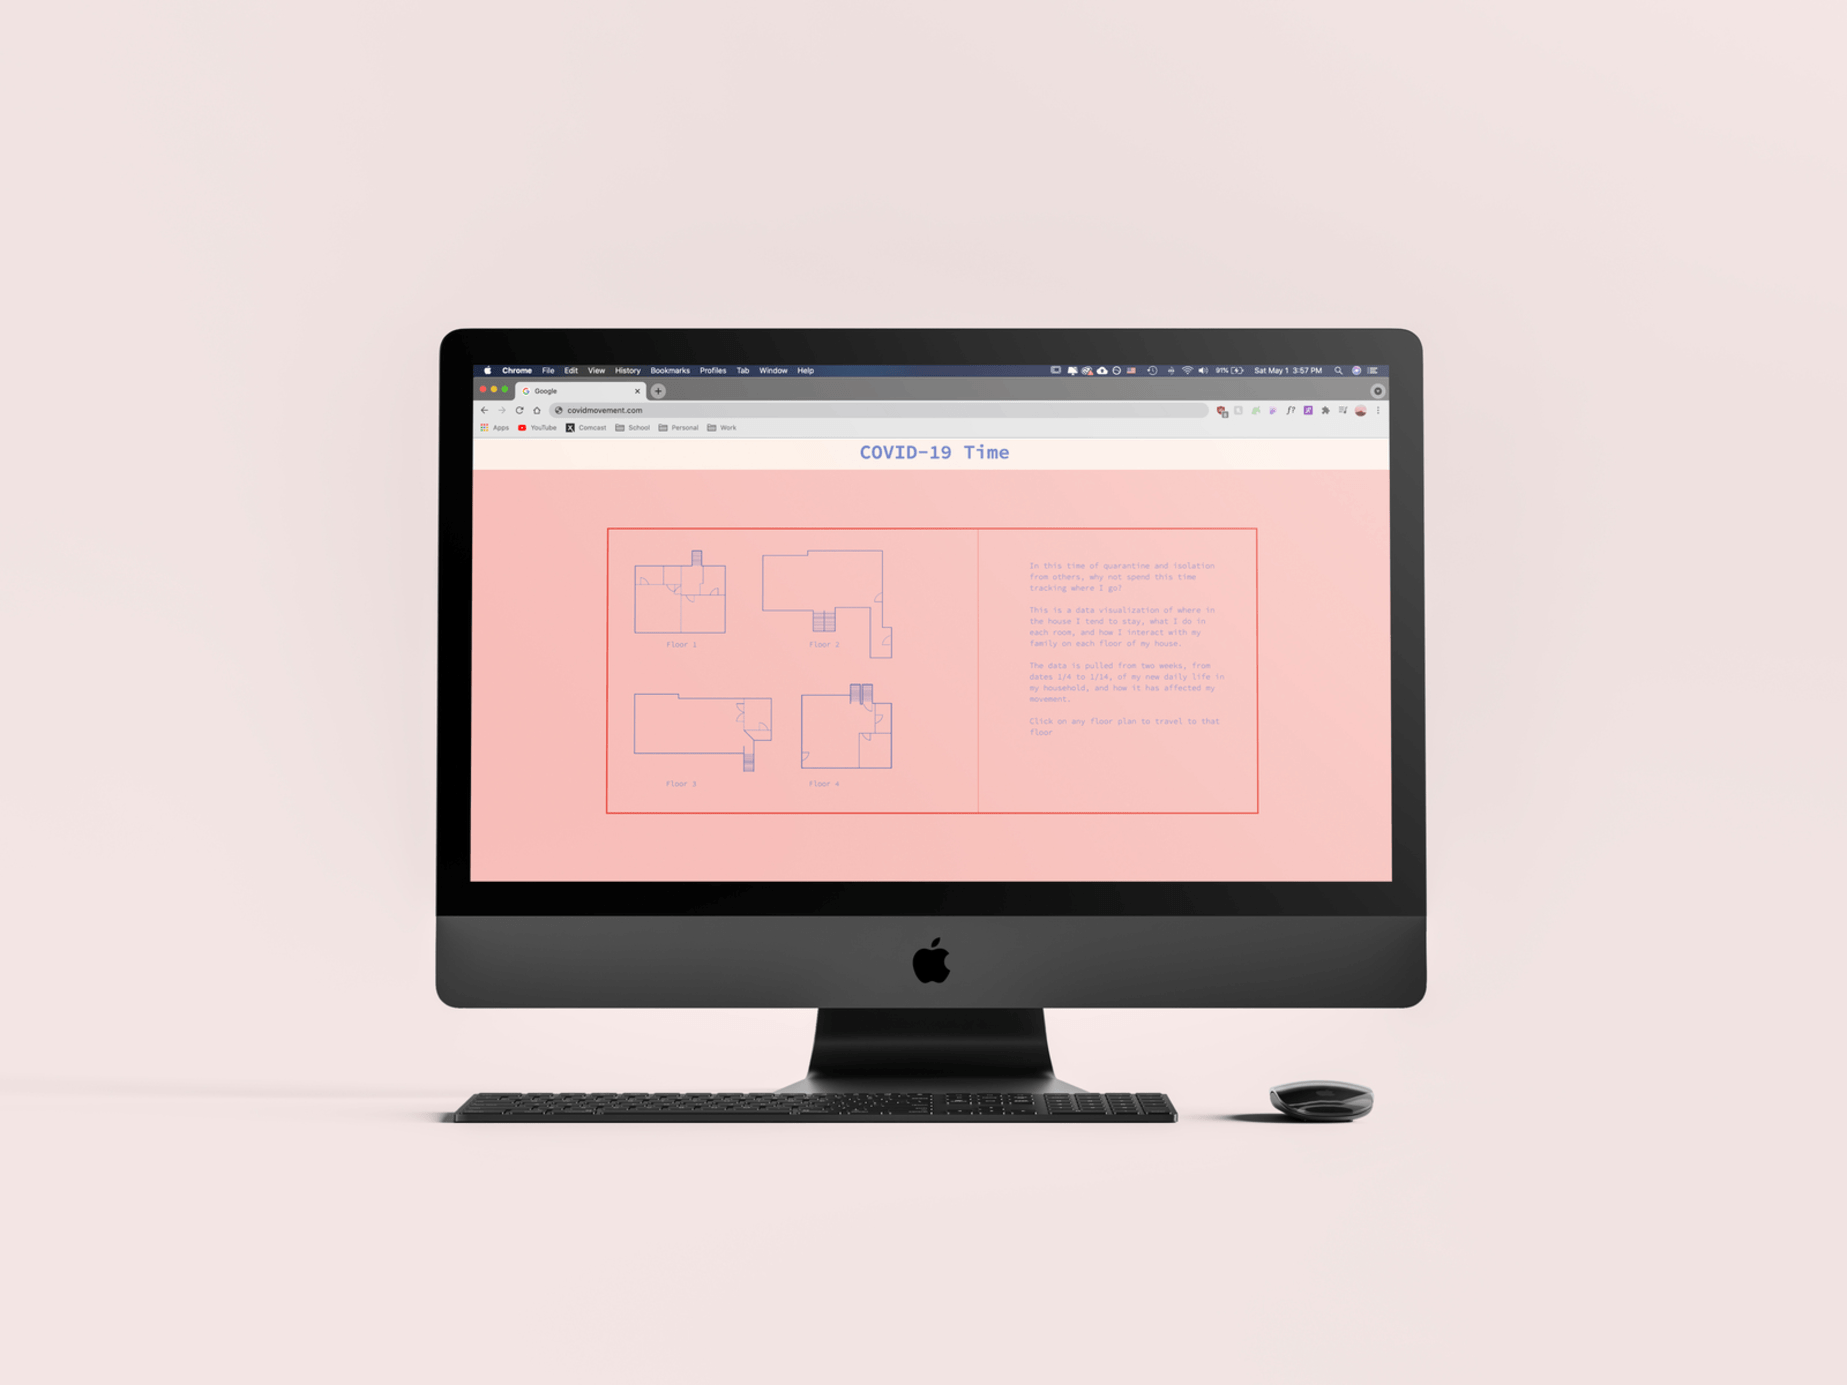
This website was created at the very beginning of COVID lockdown, where we had to live in a new normal of being contained to only our house.
To make up for it, I decided to track my day-to-day movements, along with data collected, and curate a website to display this information.
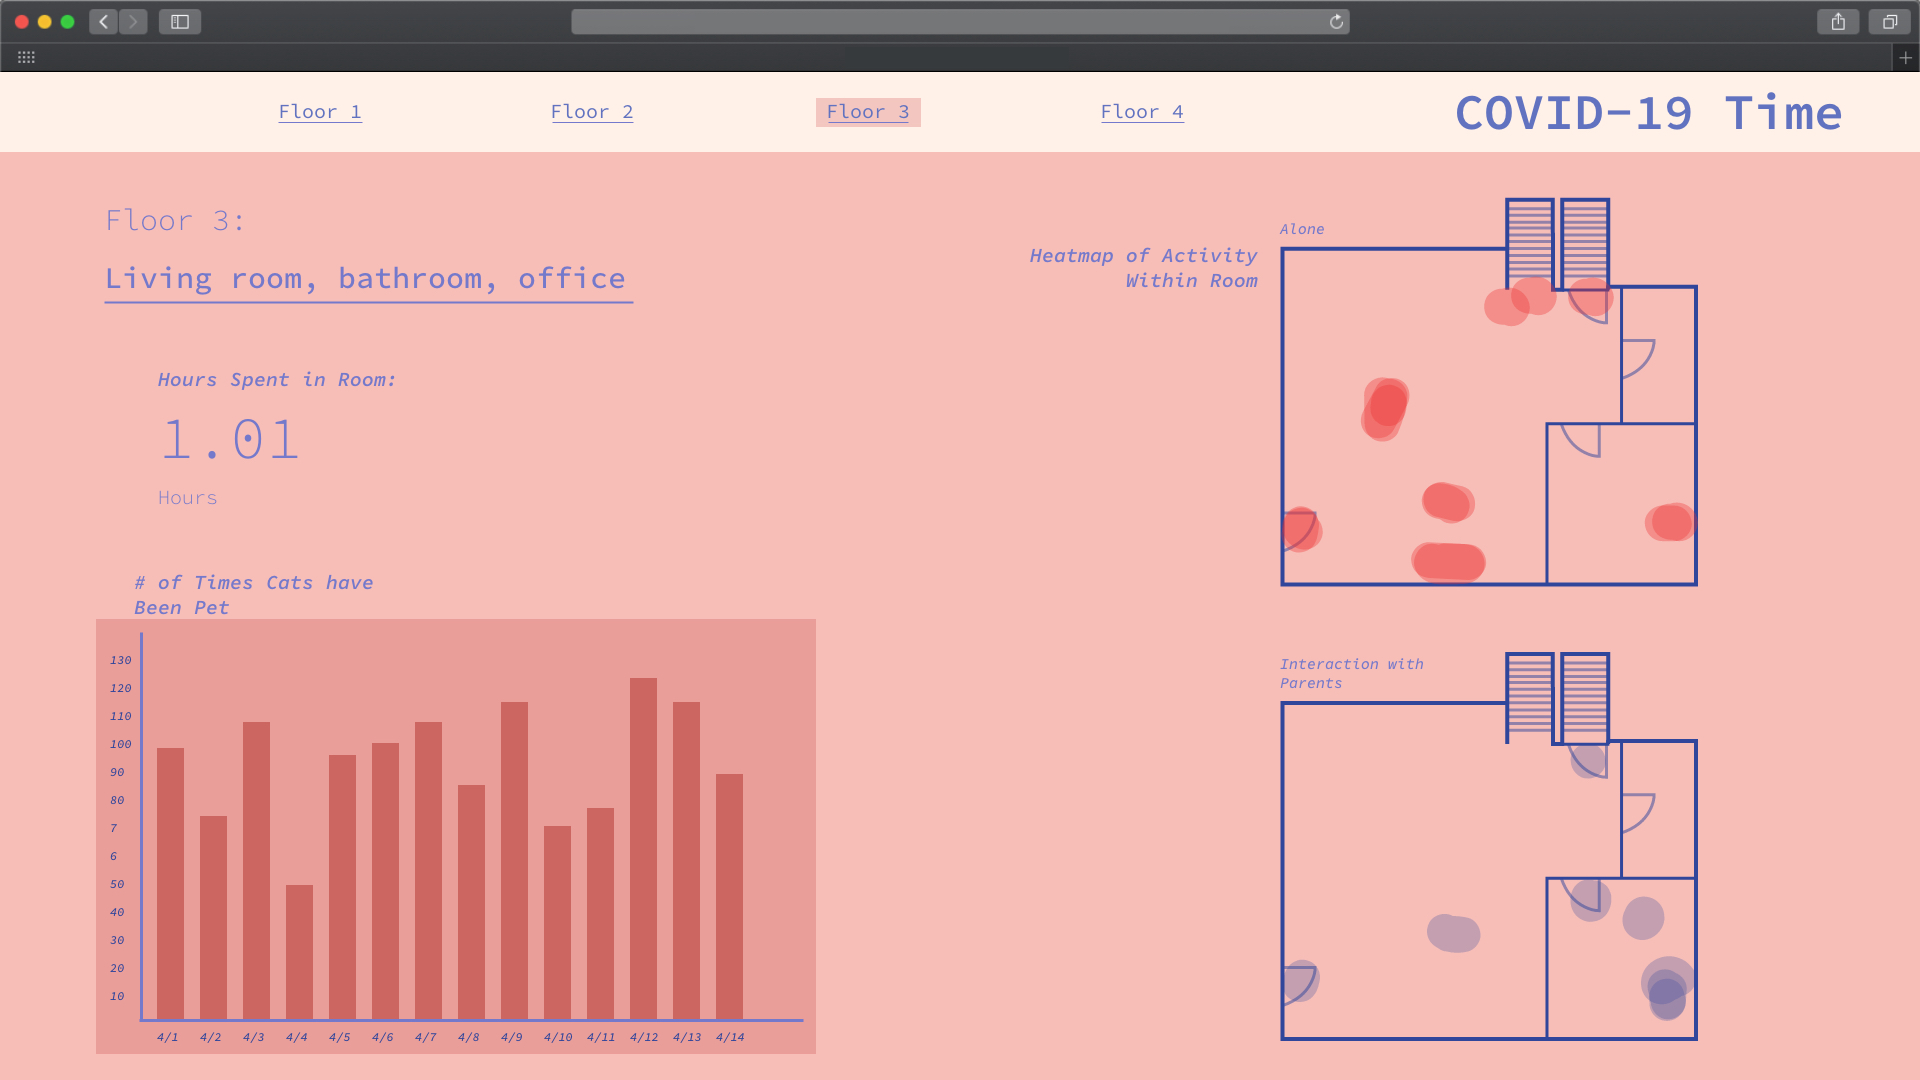
The data collected are heat maps of common areas I went to, time I spent doing homework and class, how often I found myself petting my cats, etc.
PROCESS
︎︎︎ Research:
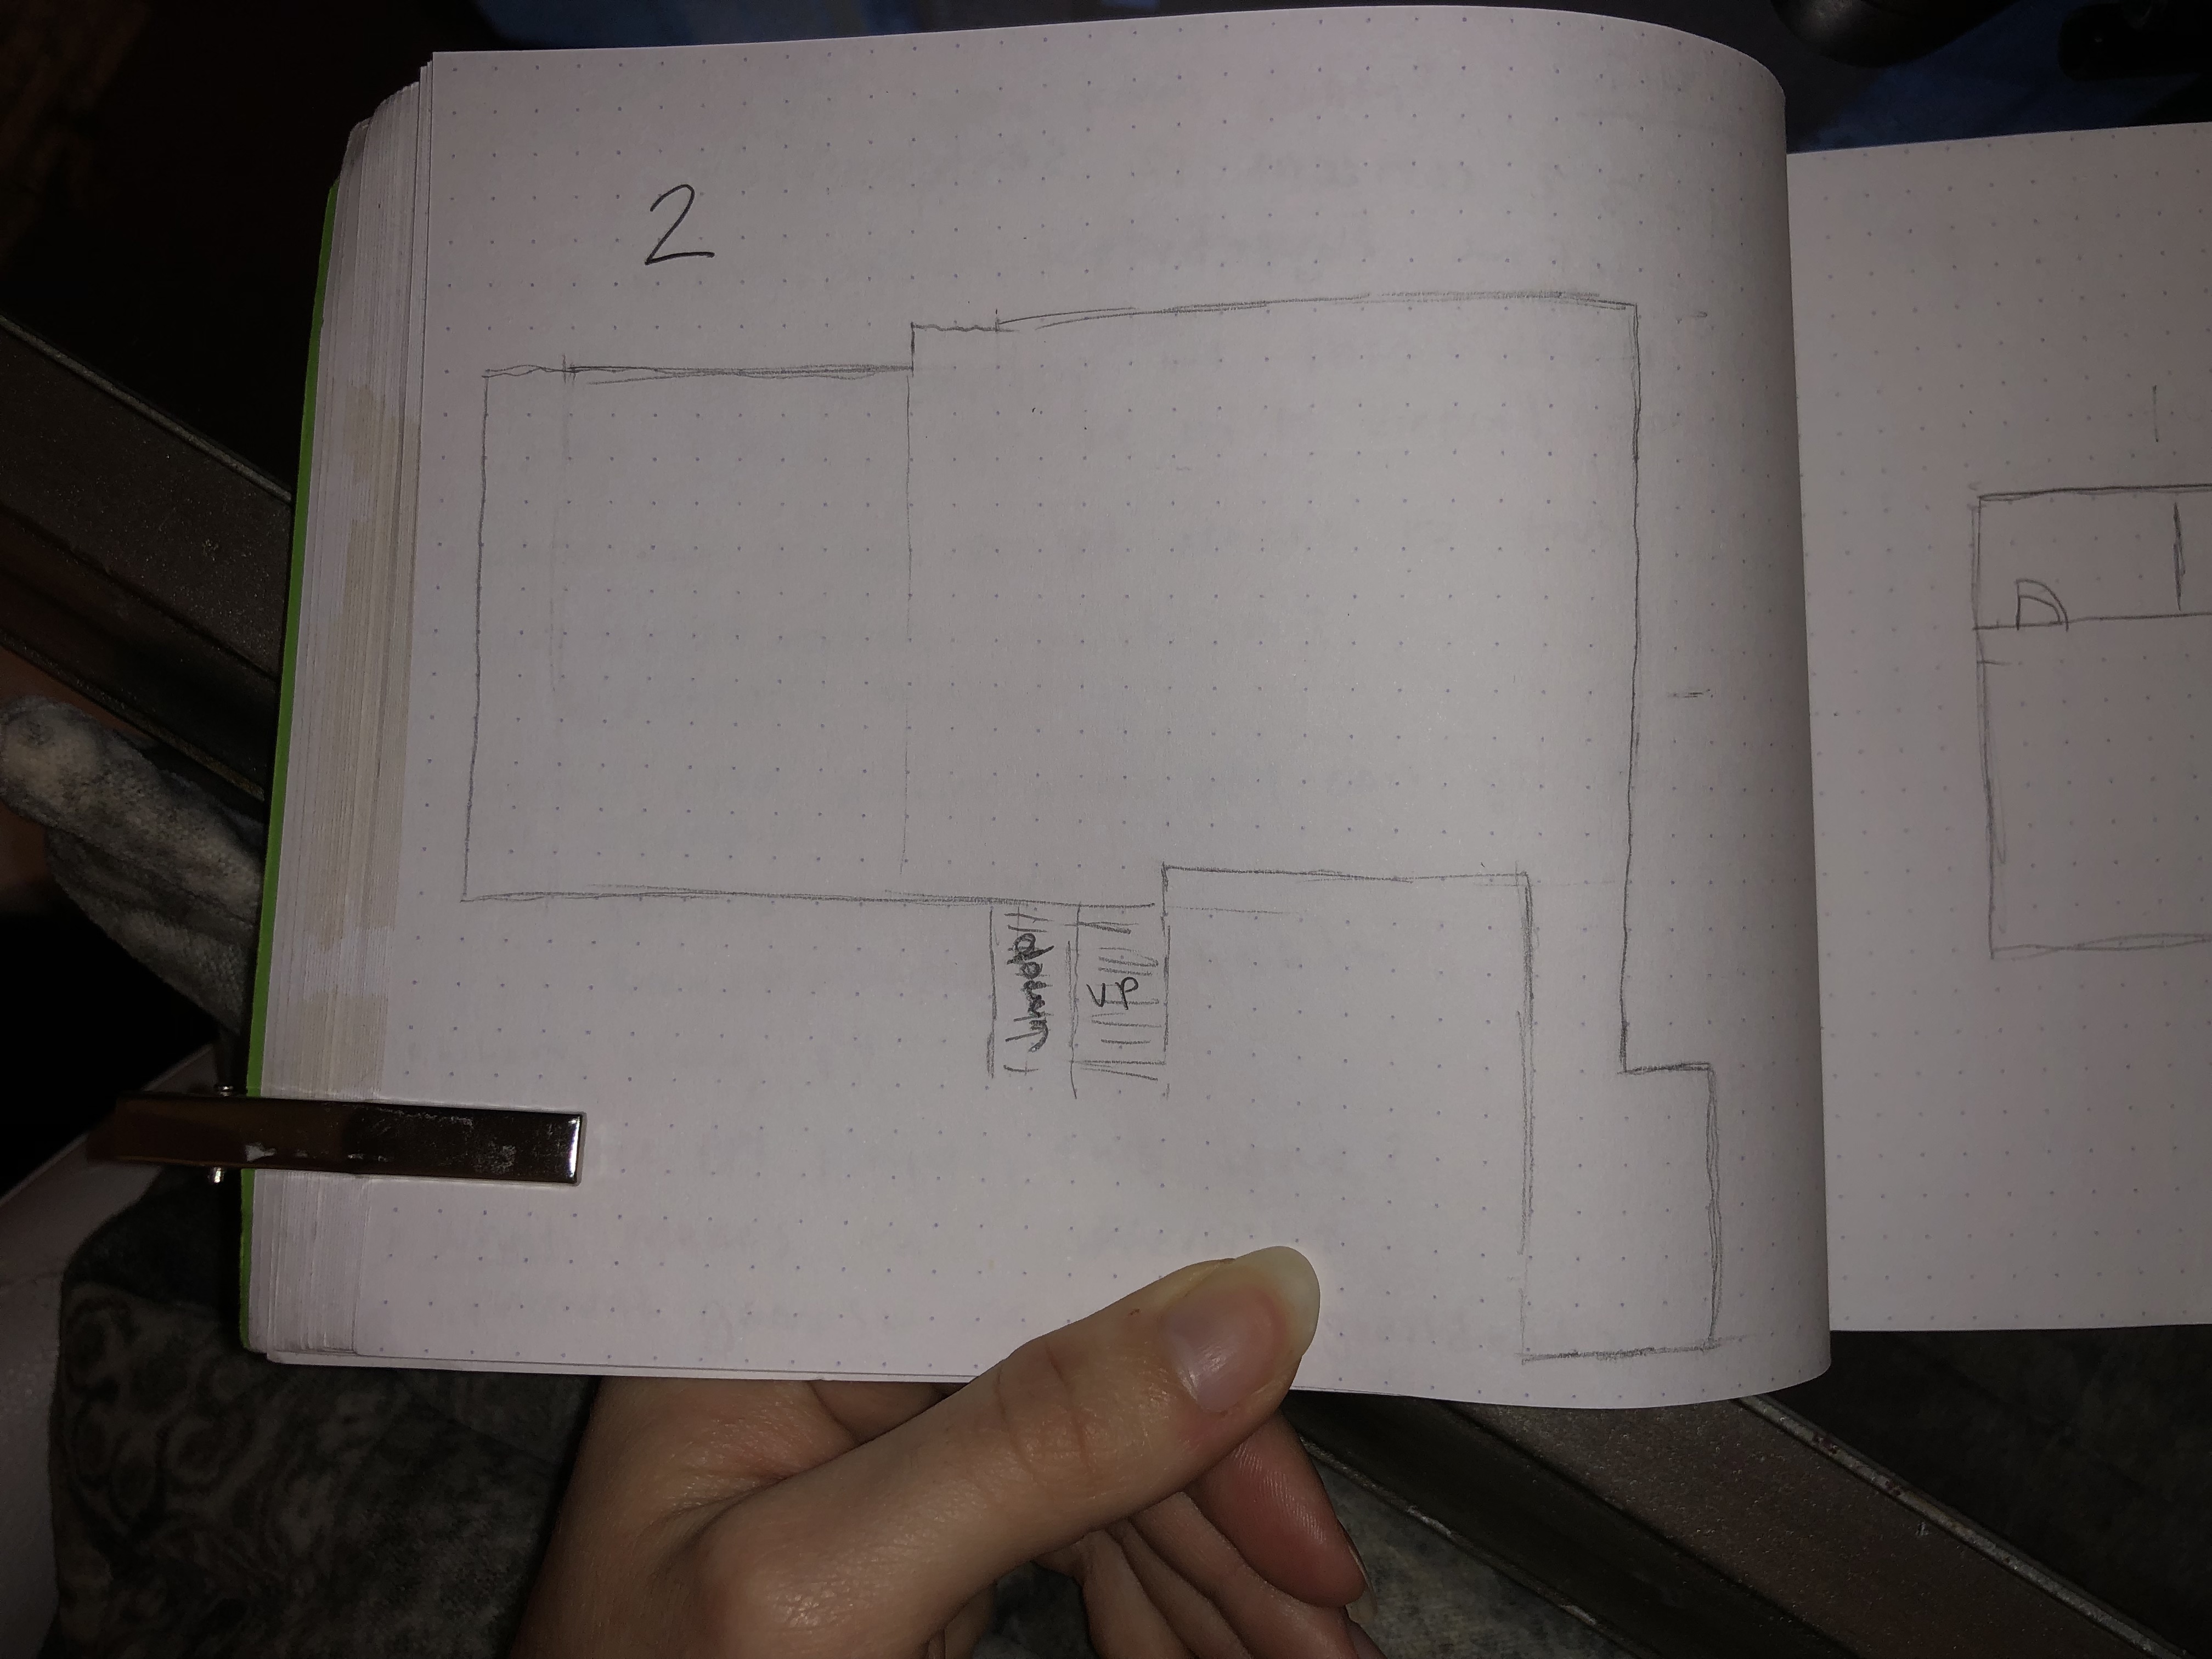
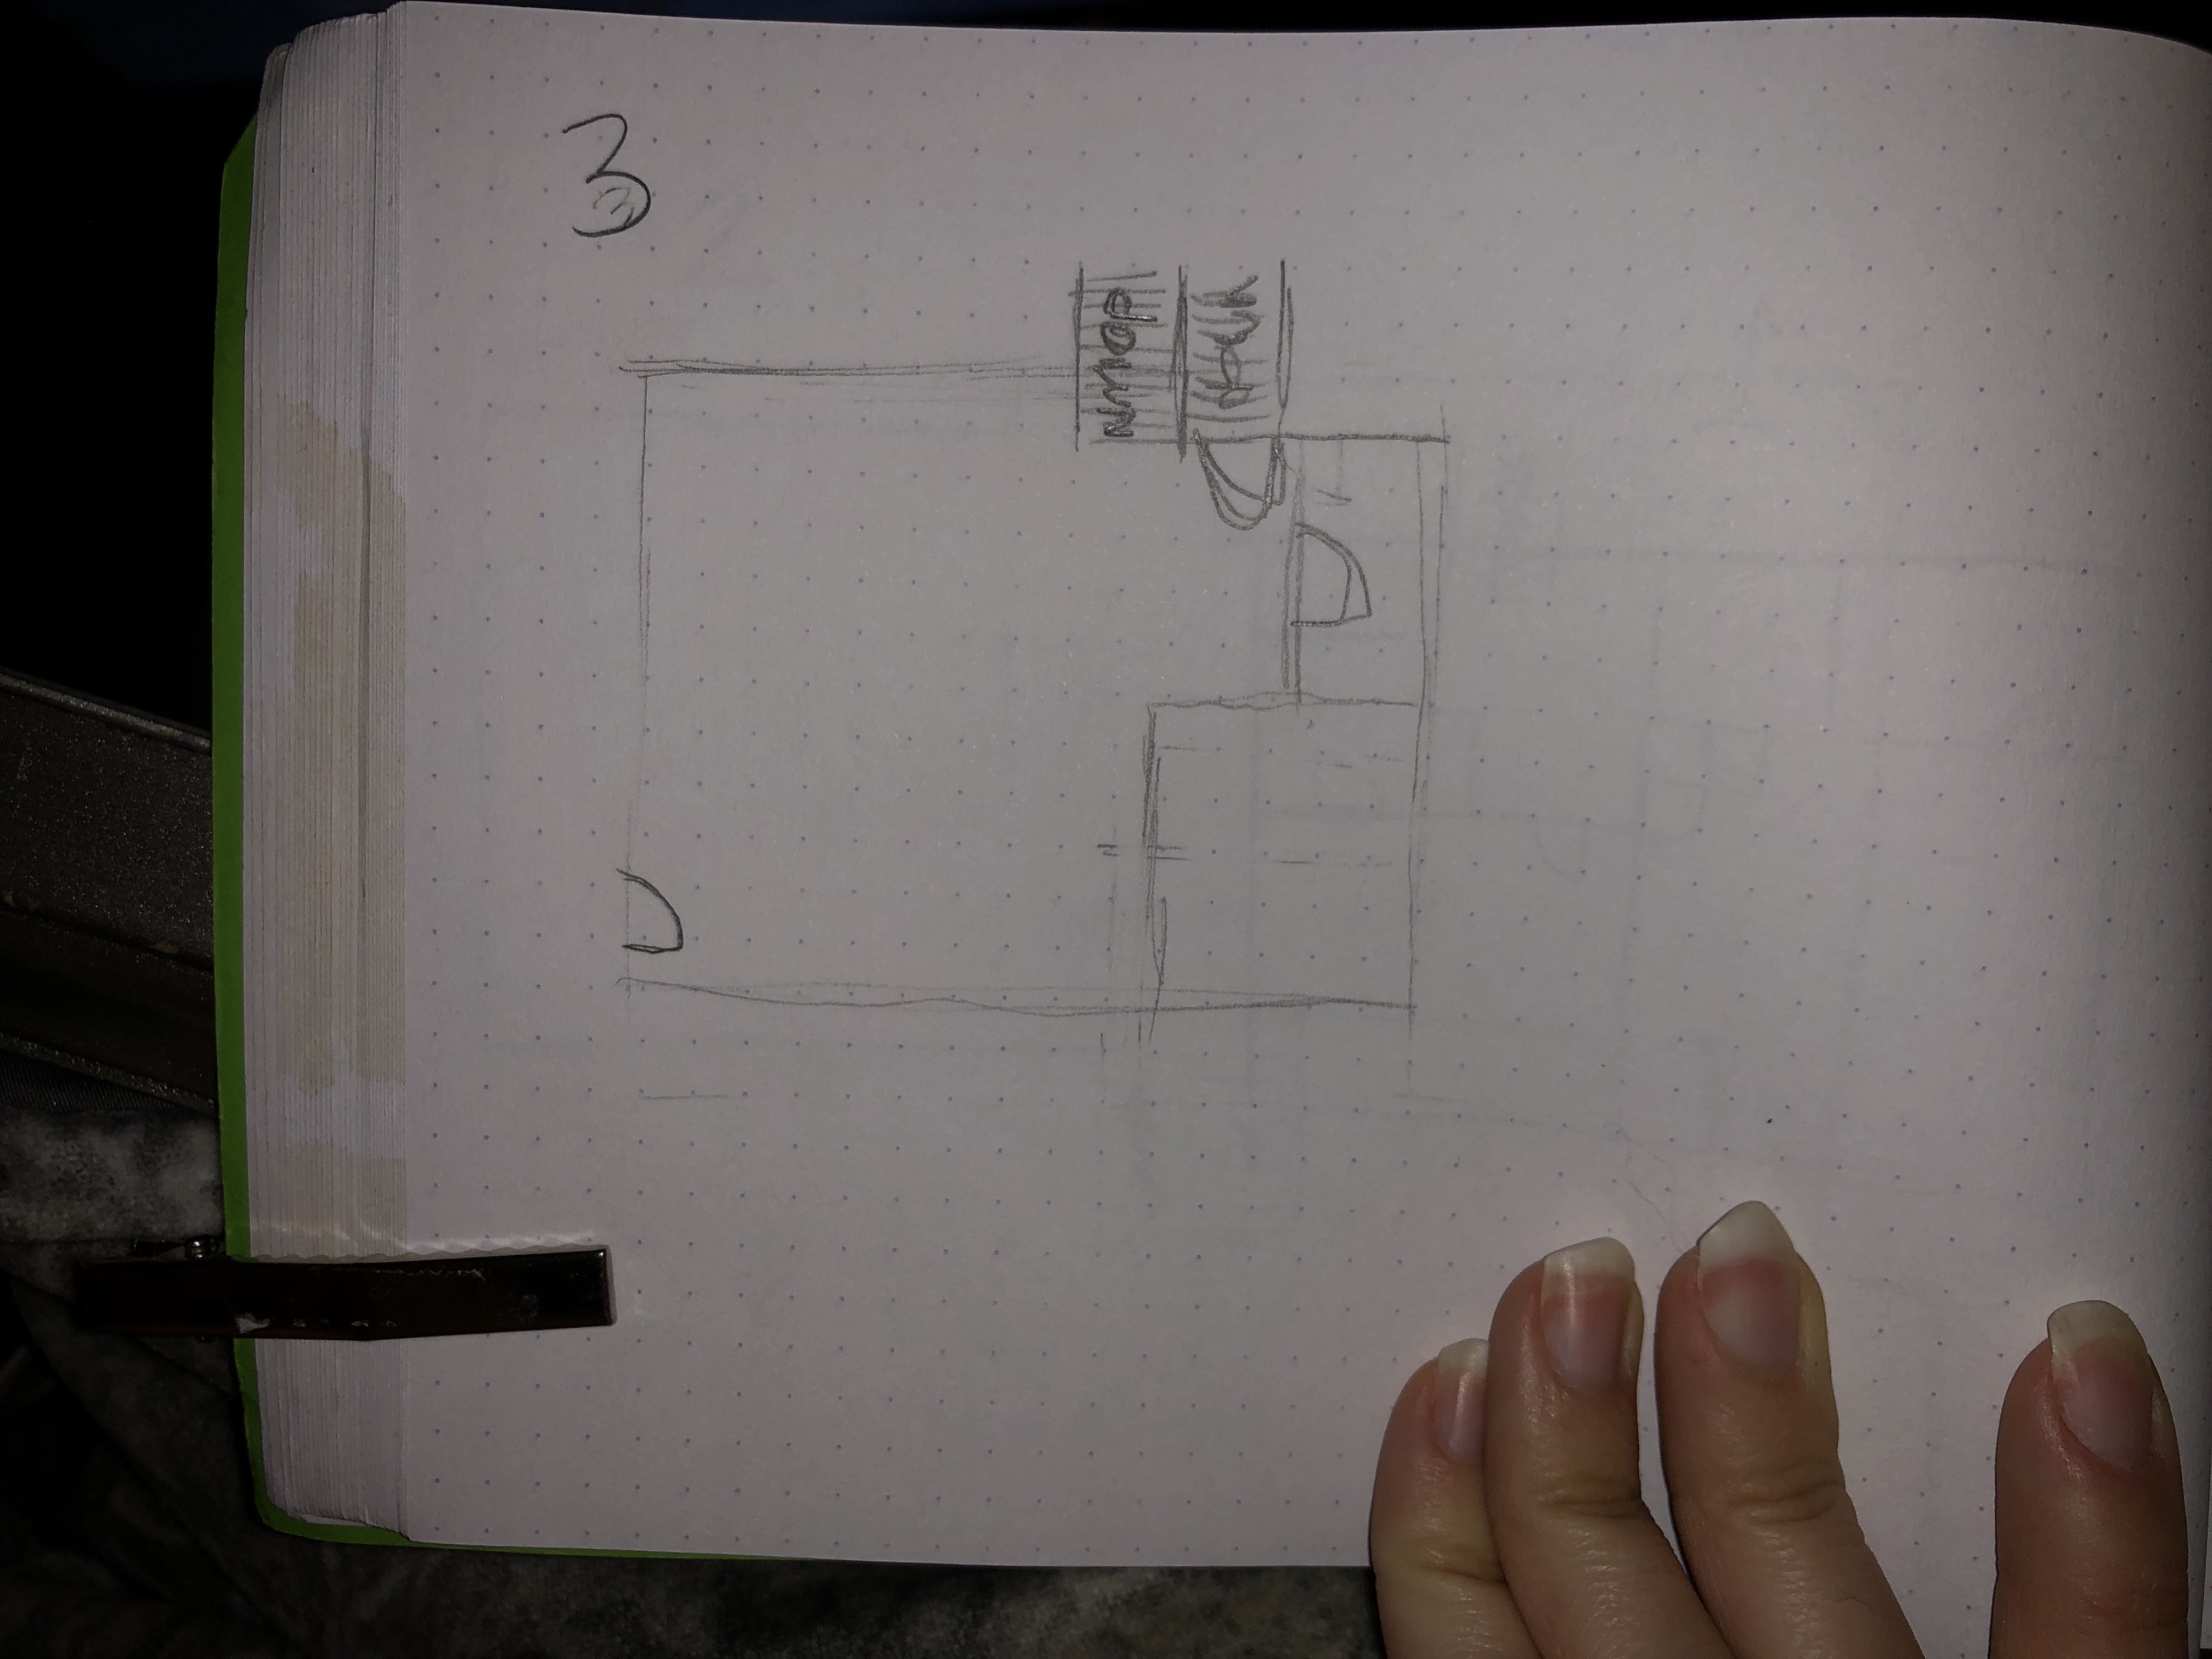

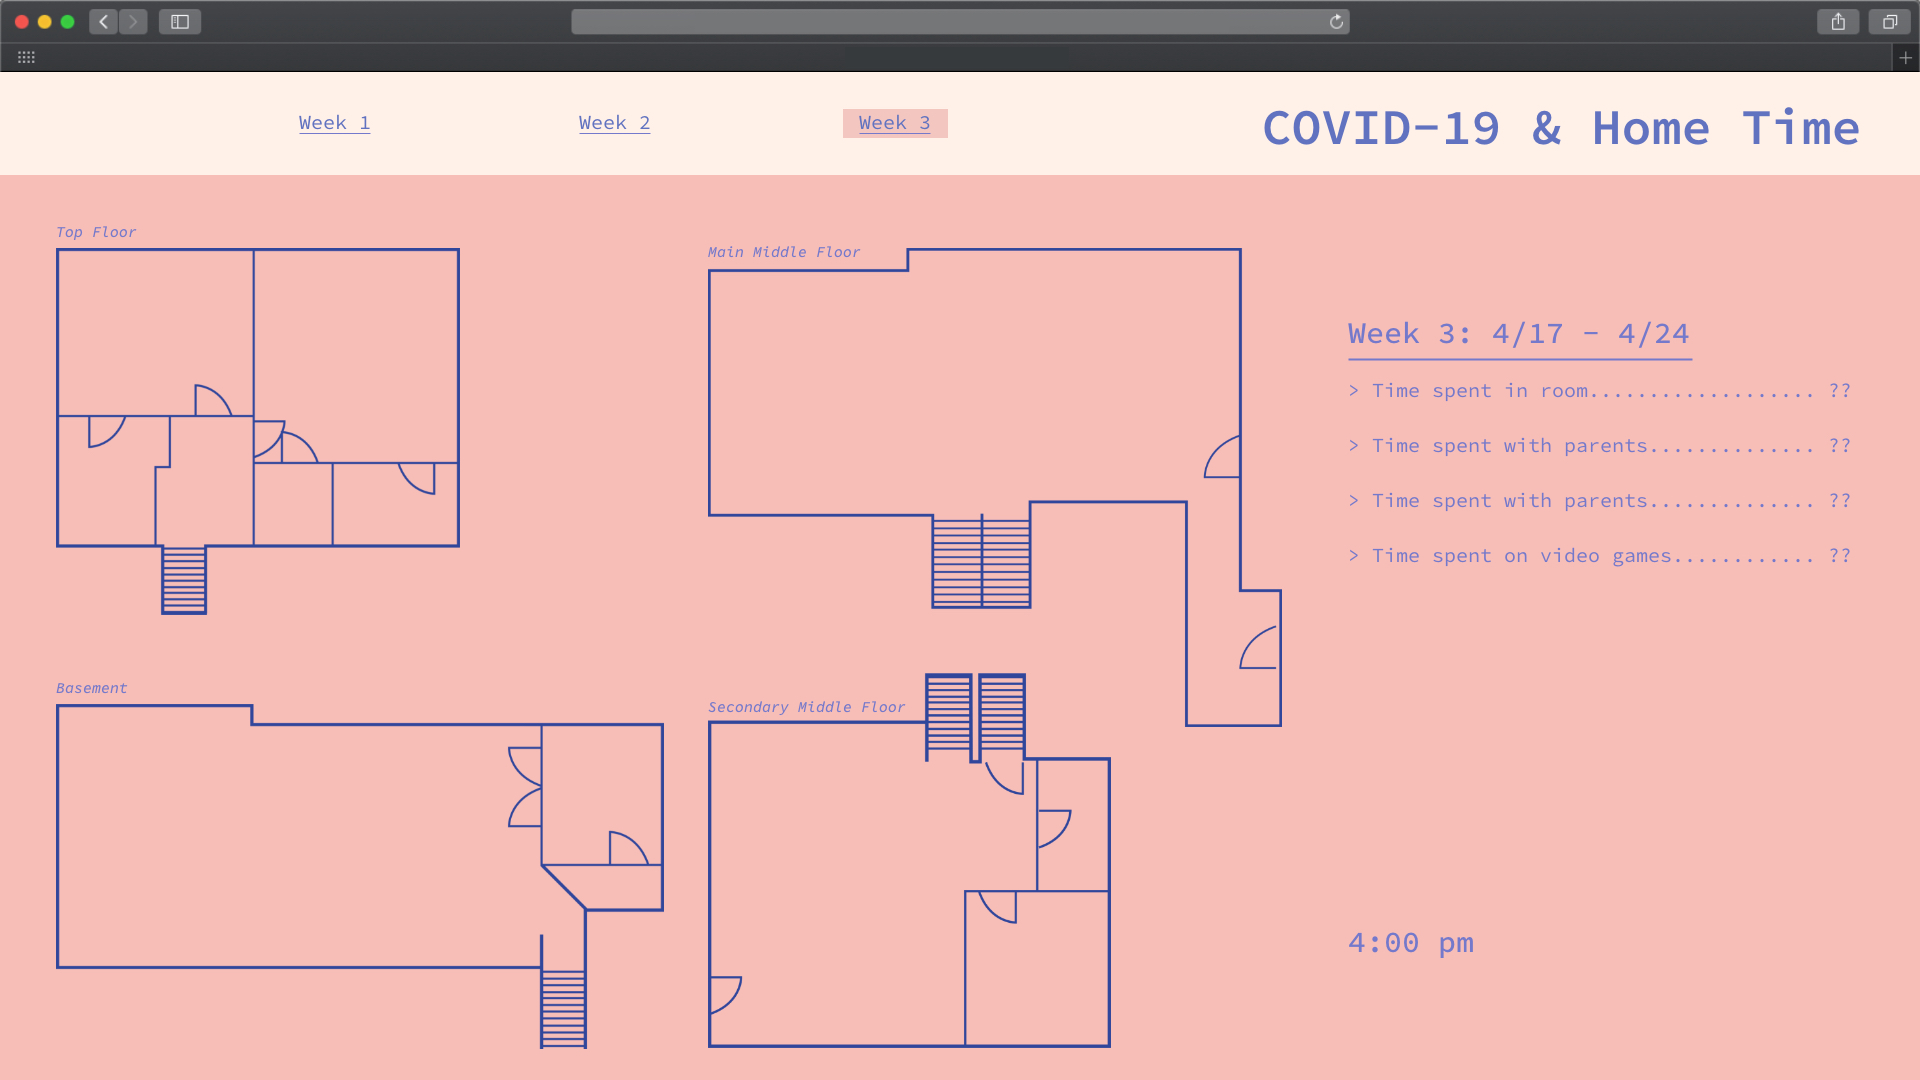
The objective of this project was to find ways to collect data, and create a successful outcome of said data collection. With COVID and the lockdown preventing us from leaving the home, I decided to record how I spent my time indoors. The information is divided up by the floors of my house, and with each level, a series of data was collected. It started with sketching the basic layout of each floor of the house.

︎︎︎ Prototype V1:
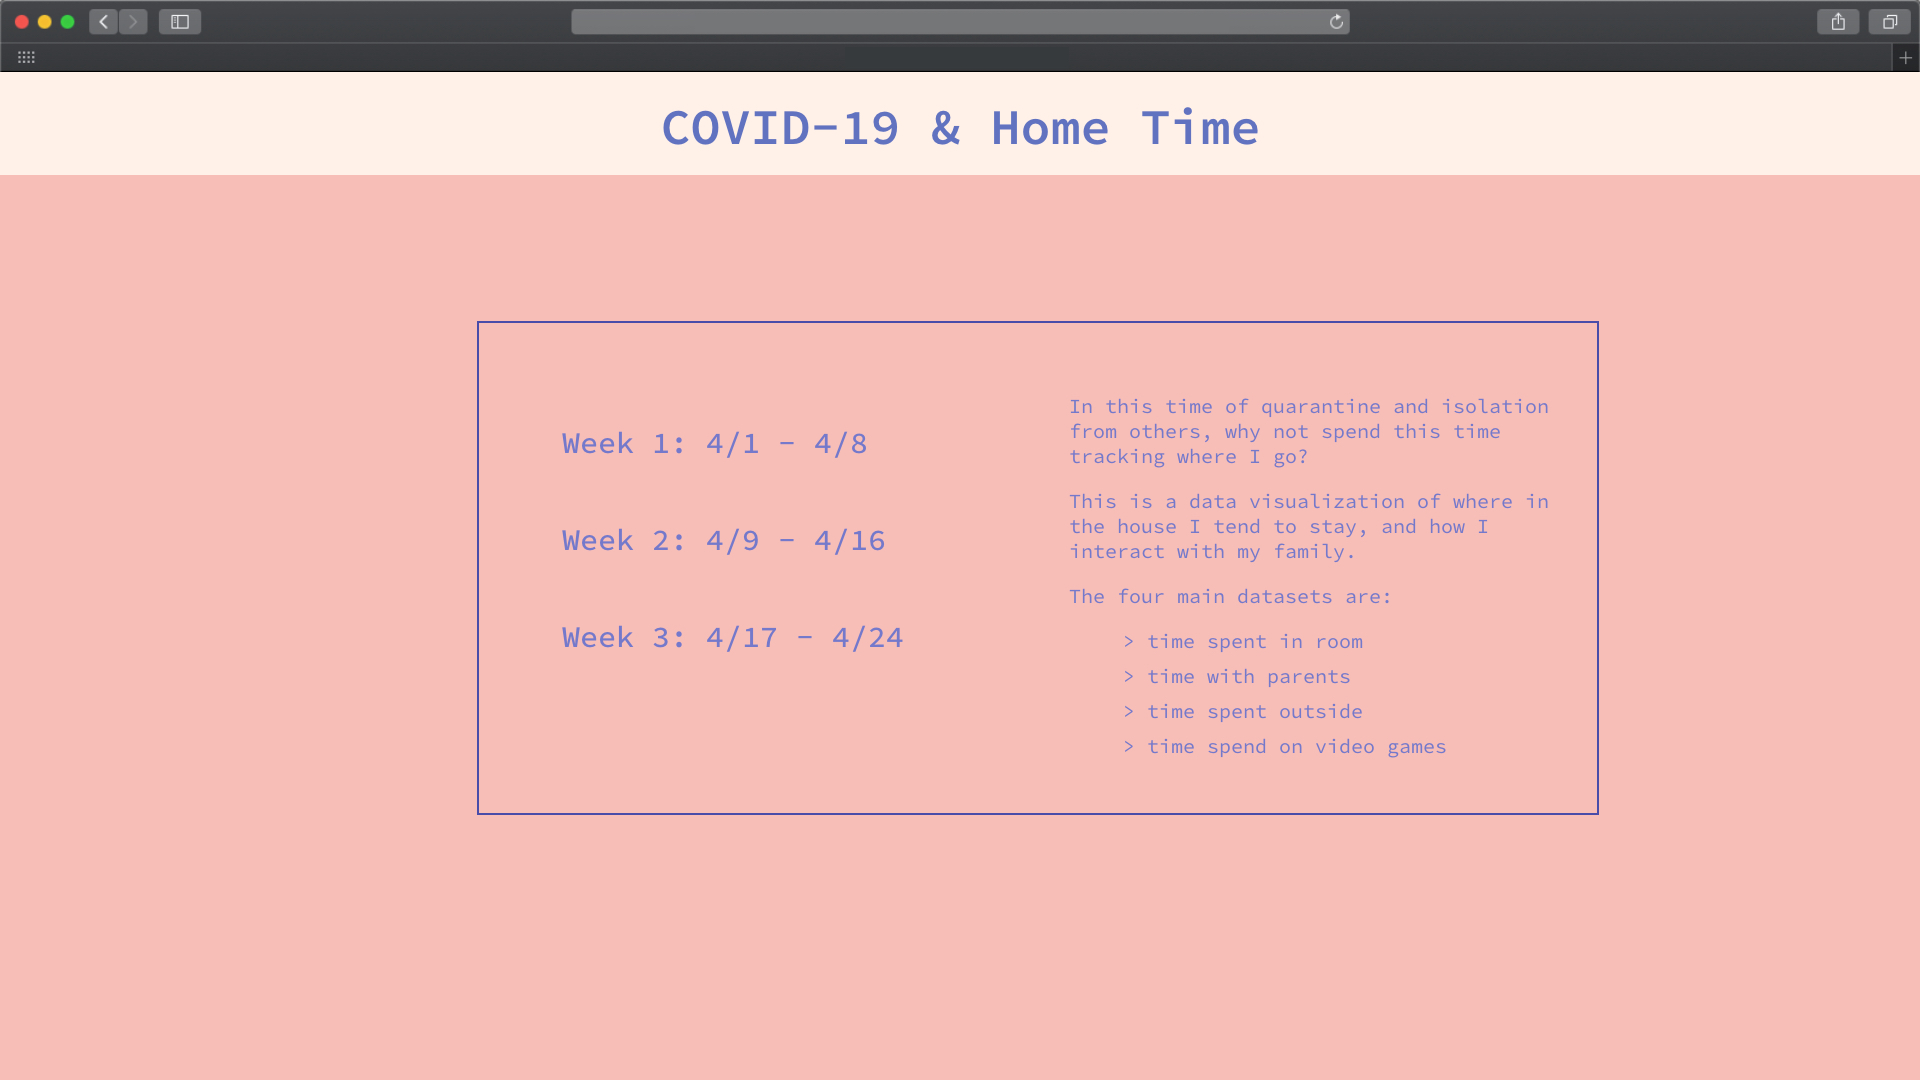

From the sketches, a rough draft emerges, created in Adobe XD. This rough draft was thought of as each webpage being shown data on a weekly basis, but it was proven to have fallen flat, and needed to be re-worked.
︎︎︎ Prototype V2:


This second rough draft was very close to the final product, and has now become more diverse in the both layout and information given. From this rough draft, the final website, as seen in beginning of this page, was created.